Wednesday 5 November 2014

Pentaho Schema workbench and Saiku Analytics


Mondrian

Mondrian is an OLAP engine written in Java. It executes queries written in the MDX language, reading data from a relational database (RDBMS), and presents the results in a multidimensional format via a Java API
  • It is a designer interface that allows you to create and test Mondrian OLAP cube schemas visually.
  • The Mondrian engine processes MDX requests with the ROLAP (Relational OLAP) schemas.
  • These schema files are XML metadata models that are created in a specific structure used by the Mondrian engine.
  • These XML models can be considered cube-like structures which utilize existing FACT and DIMENSION tables found in your RDBMS.
  • It does not require that an actual physical cube is built or maintained; only that the metadata model is created.
PSW:

If you want to create your schemas as per your requirement then you need to use PSW

Feature of PSW:
  • High performance, interactive analysis of large or small volumes of information
  • Dimensional exploration of data, for example analyzing sales by product line..so on
  • High-speed queries through the use of aggregate tables in the RDBMS
  • Advanced calculations using the calculation expressions of the MDX language
Saiku Analytics

Saiku has a much lightweight architecture on the client side than our sample application and the plugin, so it can be deployed and embedded virtually anywhere.

Saiku Analytics for pentaho is a web-based Ad-hoc reporting tools.

It’s a plug-in for pentaho. You can download and install from Penthao Market Place in Penthao Server.

Features of Saiku Analytics
  • Drag & Drop Report-Design
  • Export to: PDF,CSV,XLS,CDA,PRPT
  • Uses Pentaho Report Designer PRPT-Templates
  • Grouping
  • Aggregation
  • Performance tuning
  • OpenFormula Support
  • Charts: new chart types (heatgrid, area, dot and others) , improved settings, upgrade to ccc2, improved result, basic chart export

 Sumit Bansal
 BI Developer

Wednesday 17 September 2014

Pentaho Repository Synchronizer (PRS) Plugin in Pentaho 5.0

Hello Guys,

In this post i would like to explain How to use Pentaho Repository Synchronizer (PRS) in Pentaho 5.0

The Pentaho Repository Synchronizer (PRS) is a Pentaho plugin that allows you to interact with the solution repository of Pentaho 5.0 by keeping the disk-based file structure synchronized with the Pentaho internal solution repository (JCR).


There's no filesystem counterpart for the JCR files. so You may need to install the Pentaho Repository Synchronizer, a community plugin available in the Pentaho Marketplace.


Click on the Repository Synchronizer plugin under the Tools menu.:


That will "sync" the JCR with a folder inside pentaho-solutions/system/repositorySynchronizer.


How it works
It has 3 modes of work:
   1) Transfer from JCR to File System
   2)Synchronize JCR with File System
   3)Transfer to JCR from File System


 However, the sync is rather limited. It only checks for differences in filesize and does not track changes that have no size impact. Plus, when you sync, there's no control over which version gets written over.

 I advise you to be extremely careful with the synchronisation process, and only select the two copy modes: copy from JCR to filesystem and copy to JCR from filesystem.

This plugin is very useful for deploy the code in Pentaho 5.0 and also helping to improve the Version control system (VCS).

Cheers !!!!!
 
If you have any question you can ask me or else you can drop me email :


Sumit Bansal
BI Developer
sumitbansal450@gmail.com

References:

http://pedroalves-bi.blogspot.in/2013/12/new-pentaho-application-pentaho.html


Tuesday 26 August 2014

D3 Chart in Pentaho CDE

Hey Guys,

In this post i would like to share my experience on D3 charting library along with Pentaho C-Tools.

In this example you will learn:

1) How to render d3 chart in Pentaho CDE
2) How to pass the parameter in D3 chart
3) How to add Legend in D3 chart
4) How to add chart Title along with X-axis and Y-axis label.

Version C-Tools(CDE,CDF,CDA,CGG) - Version14.06.18 stable with bootstrap support.

Example:

Step 1:Layout:Create the layout as per your requirement.

Step 2:Datasource:select distinct first_name as letter,salary as frequency from employee where salary!=20 limit 20

Step 3:Components

D3 Components - D3 component -

In properties for Custom Chart Script write below code.

function f(dataset){
 
   
    var data = this.cdaResultToD3Array(dataset);

    var margin = {top: 45, right: 20, bottom:30, left: 80},
    width = 960 - margin.left - margin.right,
    height = 500 - margin.top - margin.bottom;

 var colors =    [ ["Letter", "steelblue"]];
                 
//var formatPercent = d3.format("%");

var x = d3.scale.ordinal()
    .rangeRoundBands([0, width], .1, 1);

var y = d3.scale.linear()
    .range([height, 0]);

var xAxis = d3.svg.axis()
    .scale(x)
    .orient("bottom");

var yAxis = d3.svg.axis()
    .scale(y)
    .orient("left");
  // .tickFormat(formatPercent);

d3.selectAll("svg").remove();

var svg = d3.select("#"+this.htmlObject).append("svg")
    .attr("width", width + margin.left + margin.right)
    .attr("height", height + margin.top + margin.bottom)
  .append("g")
    .attr("transform", "translate(" + margin.left + "," + margin.top + ")");


var tooltip = d3.select("#"+this.htmlObject).append("div")
        .attr("class", "tooltip")
        .style("opacity", 0);
       
  data.forEach(function(d) {
    d.frequency = +d.frequency;
  });

  x.domain(data.map(function(d) { return d.letter; }));
 y.domain([0, d3.max(data, function(d) { return d.frequency; })]);

 // xAxis
svg.append("g")
      .attr("class", "x axis")
      .attr("transform", "translate(0," + height + ")")
      .call(xAxis);
// yAxis
svg.append("g")
    .attr("class", "y axis")
    .attr("transform", "translate(0 ,0)")
    .call(yAxis)
    ;
// xAxis label
svg.append("text")
    .attr("transform", "translate(" + (width / 2) + " ," + (height + margin.bottom  ) +")")
    .style("text-anchor", "middle")
        .style("font-size", "16px")
    .text("Letter");
//yAxis label
svg.append("text")
        .attr("transform", "rotate(-90)")
        .attr("y", 0 - margin.left)
        .attr("x", 0 - (height / 2))
        .attr("dy", "1em")
        .style("text-anchor", "middle")
            .style("font-size", "16px")
        .text("Frequency");

  svg.selectAll(".bar")
      .data(data)
    .enter().append("rect")
      .attr("class", "bar")
      .attr("x", function(d) { return x(d.letter); })
      .attr("width", x.rangeBand())
      .attr("y", function(d) { return y(d.frequency); })
      .attr("height", function(d) { return height - y(d.frequency); })
       .on("mouseover", mouseover)
      .on("mouseout", mouseout);
     
      svg.append("text")
        .attr("x", (width / 2))
        .attr("y", 0 - (margin.top / 2))
        .attr("text-anchor", "middle")
        .style("font-size", "16px")
        .style("text-decoration", "underline")
        .text("Global & Local Searches");
   
    // add legend  
var legend = svg.append("g")
        .attr("class", "legend")
        //.attr("x", w - 65)
        //.attr("y", 50)
        .attr("height", 100)
        .attr("width", 100)
        .attr('transform', 'translate(-20,50)');

var legendRect = legend.selectAll('rect').data(colors);

legendRect.enter()
    .append("rect")
    .attr("x", width - 65)
    .attr("width", 10)
    .attr("height", 10);

legendRect
    .attr("y", function(d, i) {
        return i * 20;
    })
    .style("fill", function(d) {
        return d[1];
    });

var legendText = legend.selectAll('text').data(colors);

legendText.enter()
    .append("text")
    .attr("x", width - 52);

legendText
    .attr("y", function(d, i) {
        return i * 20 + 9;
    })
    .text(function(d) {
        return d[0];
    });
   
 function mouseover(d) {
   tooltip
       .transition()
       .duration(100)
       .style("opacity", .9);
   
  tooltip
      .html(d.letter  + ": " + d.frequency)
      .style("top", (d3.event.pageY-0)+"px")
      .style("left",(d3.event.pageX+0)+"px");
}

// Toggle children on click.
function mouseout(d) {
    tooltip.transition()
    .duration(200)
    .style("opacity", 0);
}
}

4)Add Parameter.

5)Add select component and on the basis of selecting drop down value the o/p will be shown below.


Output:


Cheers !!!!!
 
If you have any question you can ask me or else you can drop me email :


Sumit Bansal
BI Developer
sumitbansal450@gmail.com
 
References:
1)http://bl.ocks.org/Caged/6476579
2) http://bl.ocks.org/mbostock/raw/3885705/
3) http://bl.ocks.org/mbostock/3885304
4) http://bl.ocks.org/mbostock/raw/3885304/


Wednesday 13 August 2014

import sql file from mysql console

Hey Guys..

 Here i am just explaining How to import sql backup file from mysql console.

I have seen people are always facing problem when they are importing sql backup file .Here i m telling one of easiest way how to import sql backup file .you need to follow those step as below mention:

Steps:
From the mysql console:

mysql> use Database name;
mysql>source path /to /file.sql

Enjoy !!!
Sumit Bansal
BI Developer


Tuesday 5 August 2014

New Feature in 14.07.29- Bootstrap Panel in layout section of Pentaho CDE

Hey Guys,

 Here i am just giving latest update regarding new release of C-Tools version 14.07.29

The latest stable version of C-Tools in this week is 14.07.29.

The difference between 14.06 & 14.07 releases especially bootstrap panel option available in the new release(14.07) .

Advantage :

Now we don’t need to write our external bootstrap code in HTML code in HTML section either for row and column .

Thanx a lot for pedro and team for such a great effort for that.

Bootstrap includes a responsive, mobile first fluid grid system that appropriately scales up to 12 columns as the device or viewport size increases

The Bootstrap panel latest release information:               


Grid System
Extra small devices Phones (<768px)
Small devices Tablets (≥768px)
Medium devices Desktops (≥992px)
Large devices Desktops (≥1200px)
Grid behavior
Horizontal at all times
Collapsed to start, horizontal above breakpoints
Container width
None (auto)
750px
970px
1170px
Class prefix
.col-xs-
.col-sm-
.col-md-
.col-lg-
# of columns
12
Column width
Auto
~62px
~81px
~97px

 In this image you will see Bootstrap panel concept under layout section :


 Cheers !!!!!

Sumit Bansal
BI Developer

Ref:http://getbootstrap.com/css/#grid

Thursday 31 July 2014

Tab Approach in Pentaho CDE

Hey Guys,

In this post i would like to explain How to use Tab approach in Pentaho CDE Dashboard.


In this example you will learn:

1) Creating Responsive Dashboard Structure
2) Tab Approach
3) lvy Gauge Component
4) Passing Parameter


Contact me for any type of  Demo or POC work Just drop a email or comment

Hope this post helps someone and feel free to give comments and suggestion..

Cheers..!!!!

Sumit Bansal
BI Developer
"The beautiful thing about learning is nobody can take it away from you."

Wednesday 23 July 2014

lvy Gauge component in Pentaho CDE

Hey Guys,

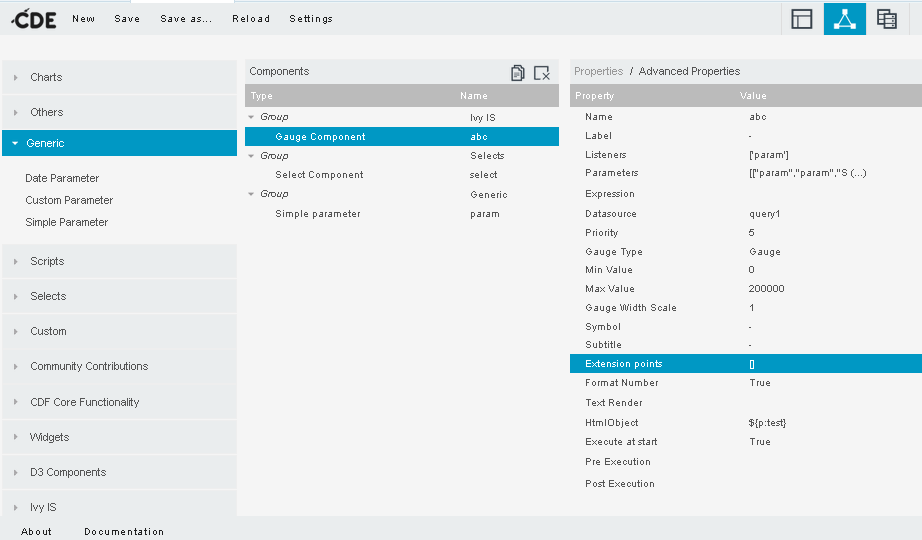
In this post i would like to explain How to use lvy Gauge component in CDE Dashboard using pentaho 5.0.1 CE.

It's really awesome component and easy to explore..

First you need to install lvy Dashboard component from market place.


1) Create the layout as per your requirement.


2) You will find lvy IS left down corner and  Take Gauge component:


3) Datasource:

Here i have created one drop down in that drop down i have defined the employee id ..based on selection it will display the employee name and salery.

Your result set should be like this..

Name Salery
-----------------
Sheri   80,000
 
i.e., it'll take  2 columns ..first column is string like value and the next would be a numeric...


4) Out put:


Note: For Customization the style you need to add some property of Gauge chart under the extension point section : http://justgage.com/

Hope this post helps someone and feel free to give comments and suggestion..

Sumit Bansal
BI Developer
"The beautiful thing about learning is nobody can take it away from you."

Tuesday 22 July 2014

Inserting images for dashboards in pentaho CDE

Hey Guys,

In this post i would like to explain How to insert image in CDE Dashboard using pentaho 5.0.1 CE.

1)Add Image Functionlity

2)Using HTML Tag

3)Using CSS

Example:

1) Using Add Iamge Functionlity

Assuming that your image is located in Public -> mySolution -> images -> logo.png:

/pentaho/api/repos/:public:mySolution:images:logo.png/content


2) Now, Add HTML tag to a column and in the HTML code give the following, code which refers the location of your image is located in Public -> mySolution -> images -> logo.png:

CODE in HTML tag:
<div class="test">

<img src="../../../api/repos/public:mySolution:images:logo.png/content" />

or

<img src="/pentaho/api/repos/:public:mySolution:images:logo.png/content" />

</div>

3) Using CSS:

.test
{

background:url('/pentaho/api/repos/:public:mySolution:images:logo.png/content');

}


Hope this post helps someone and feel free to give comments and suggestion..

Sumit Bansal
BI Developer
"The beautiful thing about learning is nobody can take it away from you."


Friday 18 July 2014

How to Render D3 Chart in Pentaho CDE

Hey Guys,

In this post i would like to share my experience It really awesome work with Pentaho C-Tools along with D3 charting library..

You just need to Install D3 components plug-in from market Place.


In this example you will learn:

1) How to render d3 chart in Pentaho CDE
2) How to pass the parameter in D3 chart
3) How to add Legend in D3 chart
4) How to add chart Title along with X-axis and Y-axis label.

Image 1: Bar chart render using D3 library

Image 2:By clicking the value from the drop down particular action will be happen


Code will be updating soon..

Hope this post helps someone and feel free to give comments and suggestion..
 
Cheers..!!!!
 
Sumit Bansal
BI Developer
"The beautiful thing about learning is nobody can take it away from you."